Join Now | Free Trial | Login | Membership


Back to listing
Back to listing
12 Feb 2018
Sources:
CFO Exclusively
I. FISHMEAL
Jan-Dec 2017:
Total 1,57 million mt (annual avg US$1,410/mt CIF) imported, including 883,232 mt ex Peru taking about 56% high. Other Big 5 are Vietnam (135,530mt), USA (100,341 mt), Chile (70,057 mt), Ecuador (57,578 mt), Russia (56,755 mt) .
Jan-Dec 2016:
Total fishmeal importing 1.03 million mt (annual avg. US$ 1,554/mt CIF)
Comments:
Guangdong (Huangpu/Guangzhou port) is the largest fishmeal port in year 2017. taking 41.8% market share and the 2nd one is Shanghai port 27.4%. Today, fishmeal inventory in China main ports at 83,000.-mt low. However, we didn’t record strong demand in domestic market before CNY mainly due to freeze weather delaying the production. Today, Peruvian fishmeal super prime is indicating at RMB 13,800-14,000/mt level for weeks while standard quality about RMB 1000-1400/mt lower. As for domestic fishmeal production is basically closed with 62% TVN 130 indication RMB 10,300/mt.
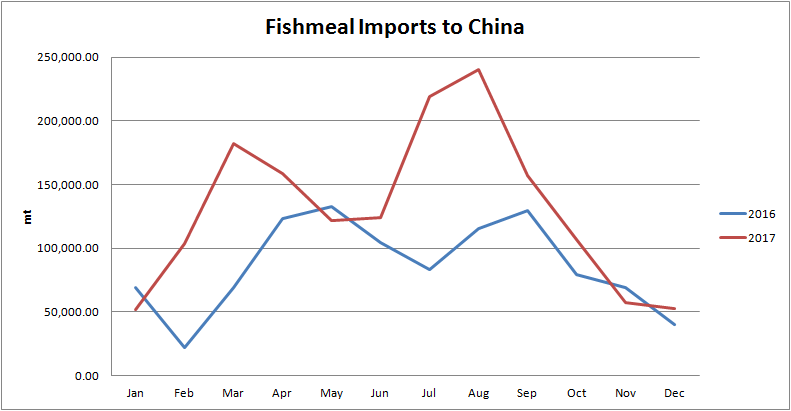
Comparison total importing quantity in year 2016 & 2017
II. Fish oil
Jan-Dec 2017:
Total Fish oil importing statistics per China customs 2017: 54,580 mt (annual avg US$2,613/mt CIF), including 30,441 mt (55%) ex Peru.
Jan-Dec 2016:
Total 33,797 mt (annual avg. US$ 2,944/mt CIF)
Comments:
Top 3 exporters to China are Peru taking over 55% (30,422 mt) , the 2nd is Vietnam 9,136 mt and the 3rd from India 5,257 mt.
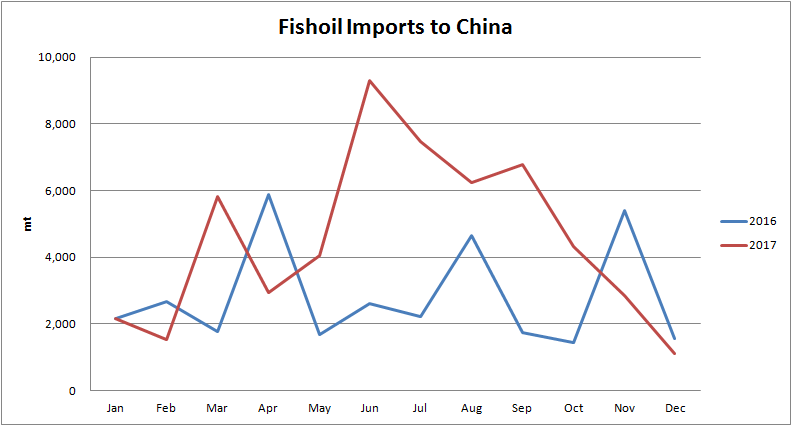
Comparison total importing quantity in year 2016 & 2017
III. Meat and Bone meal
Jan –Dec 2017:
Total MBM importing statistics per China customs 101,520 mt ( annual avg US$494/mt CIF). The major exporters are Uruguay taking 45% share (45,643 mt) and the next is Australia 32.6% market share. (33,166 mt)
Jan-Dec 2016:
83,606 mt (annual avg. US$ 407/mt CIF)
Comments:
MBM demand in Chinese market is quite steady in recent years. This year increasing quantity mainly from Australia origin. Per CFO record, total only 16,000mt Australian MBM sold to China in year 2016. Since China is not major exporting market for Australia and only when Indonesia demand weaker and cargo shifted to Chinese market. As for Australian MBM is mainly used in aqua feed due to lower ash so that major season starting from May onward.
We foresee the importing quantity will be steady to firm in coming year if no other big suppliers approved by AQSIQ.
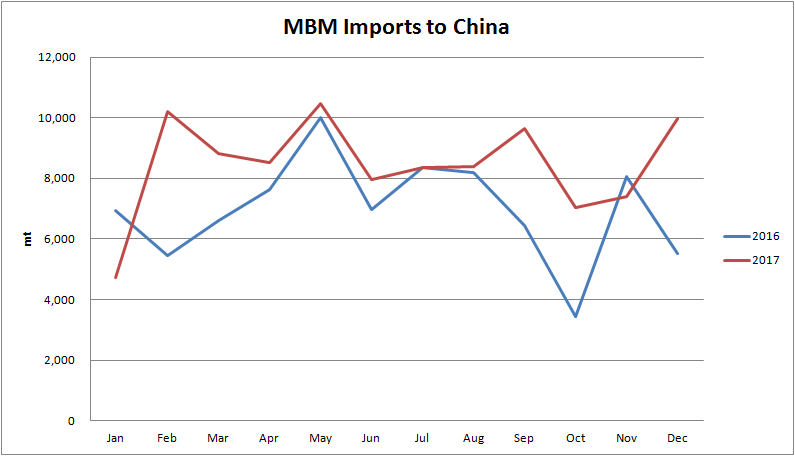
Comparison total importing quantity in year 2016 & 2017
IV. Poultry By-product Meal
Jan –Dec 2017:
Total PBM importing statistics per China customs reached 165,426 mt ( annual avg US$855/mt CIF) and USA is the suppliers dominate the market up to 97%.
Jan-Dec 2016:
Total PBM sold to china 141,371 mt (annual avg. US$ 840/mt CIF)
Comments:
PBM market is mainly followed fishmeal. In 2017, since Peruvian fishmeal prices are continuing firm and maintaining at higher level so that PBM demand is expanding as well.
Peru has 2 fishing season a year. Under the normal condition, season A starting from April and season B starting from Nov/Dec. but demand & supply of PBM is relatively regular
.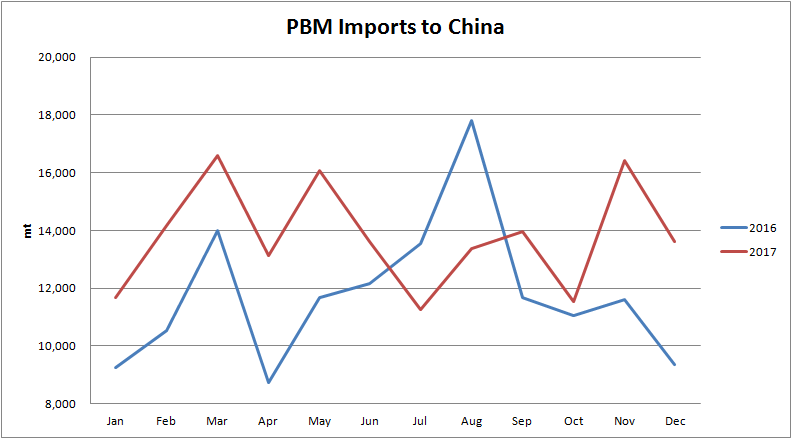
Comparison total importing quantity in year 2016 & 2017
V. Canola
Jan –Dec 2017:
Total Canola importing statistics per China customs recorded 4.74 million mt (annual avg US$455/mt CIF), and the largest supply is from Canada taking 4.51 million mt about 95% market share.
Jan-Dec 2016:
Total 3.56 million mt (annual avg. US$ 417/mt CIF)
Comments: Most of crushing plants are suspended operation so that pressure of canola meal inventory is more or less reduced.
We foresee the demand of Canola meal shall be appear coming April and price could be adjusted higher as well. Today canola meal is selling at RMB 2350/mt level.
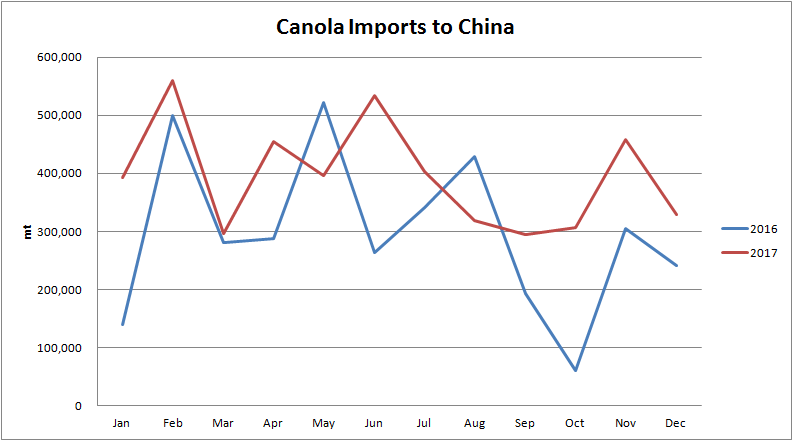
Comparison total importing quantity in year 2016 & 2017
VI. Top 20 Fishmeal importers in 2017
|
Fishmeal Imports to China by Importers 2017 |
||
|
No |
Corporation |
Quantity (MT) |
|
1 |
Xiamen Seashine Int'l Trading |
128,848.15 |
|
2 |
China CTEC |
75,890.09 |
|
3 |
Xiamen Seashine Grain & Food Development |
70,162.72 |
|
4 |
Guangdong Hadi |
54,258.28 |
|
5 |
Fujian C&D |
52,788.33 |
|
6 |
Anhui Intl |
45,988.49 |
|
7 |
Tongwei Holding |
37,719.81 |
|
8 |
China Animal Husbandry |
37,084.28 |
|
9 |
Fujian Jianteng Trading |
34,532.70 |
|
10 |
Sinopharm Fortune Way |
33,805.97 |
|
11 |
Fuzhou Ming Cai Trading |
33,305.03 |
|
12 |
Fuzhou Coland Logistics |
32,521.98 |
|
13 |
Fujian Tianma Technology |
27,424.53 |
|
14 |
Xiamen C&D Raw Material |
26,688.82 |
|
15 |
Chinalight |
26,562.10 |
|
16 |
Fuzhou Donggang Industry |
26,442.66 |
|
17 |
Kingmax Trading |
24,734.48 |
|
18 |
CMB Lumbering Trading |
24,371.86 |
|
19 |
Liaoning Expert |
23,669.39 |
|
20 |
Shenzhen Giant Pacific Industrial |
19,991.13 |
|
|
Others |
738,358.17 |
|
|
Total |
1,575,148.97 |
|
Source: China Customs |
||
Total Fishmeal Imports to China by Corporation 2017: 1,575,148.97 MT.
Total Fishmeal Imports to China by Top 20 Corporation 2017: 836,790.80 MT (53.12%)
VII. CFO Business Solutions
Chinese market news:
CFO is specialized in protein feedstuffs in China. We welcome you sign up CFO news and for the 1st time visitor, we offer a 3 weeks free trial.
Any interesting party, please feel to email: member@21cfo.com
MOA China License:
For new, renew and alteration your license, and/or set up AQSIQ establishment list, please contact CFO license center at email: license@21cfo.com
Trading Consultancy:
CFO with team members with more than 30 years trading experience in Chinese feed industry, we are not only specialized in China regulation but also actual trading practice.
For further queries, please contact : trader@21cfo.com
Also, We would like to take this opportunity to wish you have a happy lunar new year.
All the best,
CFO China/HK/Taiwan team
Reporter: Charles Wang
Contact: cfo@chinafeedonline.com
Type Report:
Monthly
Back to listing
Qualified China Licensed Suppliers around the world are here :